
I wanted my coding agent to see the same application I could see in Aspire.
The application was already modeled in .NET Aspire. I could see PostgreSQL, an Azure Storage account, the web project, and a worker in the dashboard. What the agent could see was different. It could read the AppHost code, but it did not automatically know which resources were running, whether they were healthy, or what happened during the last request.
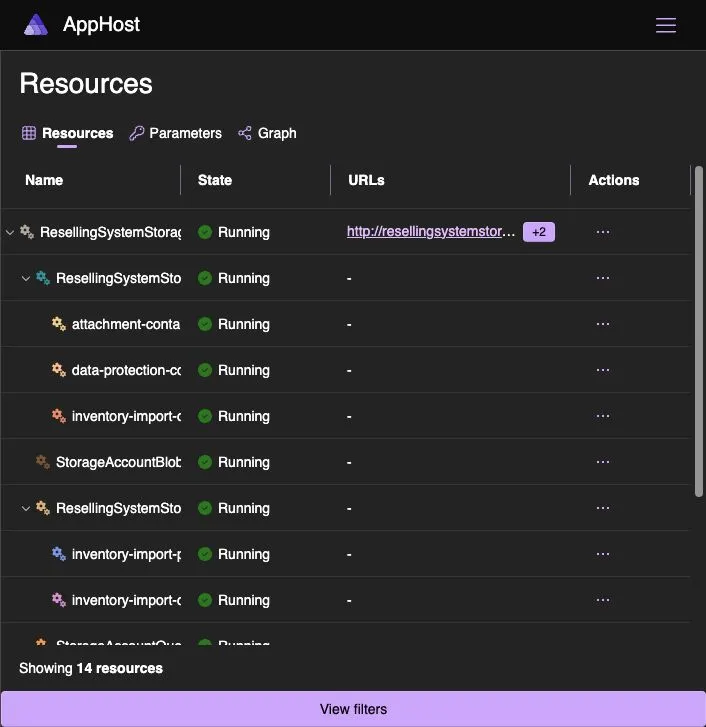
That gap became obvious when I launched the application from JetBrains Rider. The resource grid
looked healthy, but the Aspire dashboard had no useful logs, traces, or metrics for the web
application. Rather than start changing OpenTelemetry packages, I used the agent connection to
compare the Rider launch with a known-good aspire start launch.
This article walks through the complete setup I used with Codex, in both the desktop app and CLI. Then it shows how Aspire’s live data helped me find the Rider configuration problem and, later, a 46-second PostgreSQL readiness check that I was not looking for when I started.
The work was inspired by the Microsoft Build session Aspire for agents: Transform how you build and deploy distributed apps.
What connecting an agent actually means
There are two parts to Aspire’s agent support, and they solve different problems.
Aspire skills are Markdown instruction bundles. They teach an agent how to find an AppHost, start and stop it safely, wait for resources, investigate telemetry, and use isolated instances. Skills provide procedure, not runtime access.
The Aspire MCP server is the runtime bridge. It lets a compatible agent list resources, read
console and structured logs, inspect distributed traces, run resource commands, and query Aspire
documentation. The current MCP server runs through aspire agent mcp over standard input and
output. It does not open another network port.
The distinction matters. I wanted both: consistent Aspire habits in the repository and live access to the application while it was running. The Aspire agent overview, skills documentation, and MCP documentation describe those layers in more detail.
Global setup versus project setup
My original question was whether the setup belonged to the machine or the project. The answer was both, with a useful boundary between them.
- I installed Microsoft’s Aspire plugin once in my Codex environment.
- I generated Aspire skills inside this repository and committed them.
- I configured the Aspire MCP server inside this repository.
- I recorded the default AppHost inside this repository.
That gave Codex global access to the first-party Aspire plugin while keeping the application-specific behavior reproducible for anyone who clones the code.
I tested this with Aspire CLI 13.4.6, .NET SDK 10.0.400, and a .NET 10 application. Aspire is
changing quickly enough that I recommend checking the current docs and keeping the CLI and Aspire
packages aligned.
1. Install the Aspire skills for Codex
I added Microsoft’s skills marketplace and installed the Aspire plugin:
codex plugin marketplace add microsoft/aspire-skills
codex plugin add aspire@aspire-skills
This is the once-per-Codex-environment part. Codex also has an interactive /plugins flow; the
Codex plugin documentation covers plugin management in
more detail.
These are setup commands that run in a terminal. They do not mean the rest of the work has to happen in the Codex CLI. I normally work in the desktop app; the installed plugin and project configuration are available there too.
2. Generate project-local Aspire guidance
From the repository root, I ran:
aspire agent init \
  --non-interactive \
  --skills all \
  --skill-locations standard
That generated the Aspire workflow skills under .agents/skills. I committed those files so the
repository carries the same orchestration and monitoring guidance into future Codex tasks.
I used the non-interactive form because an agent should not get stuck waiting for a terminal menu.
Running aspire agent init again is also the update path when Aspire changes the generated skills.
3. Add the Aspire MCP server to the project
At the time I tested this, aspire agent init generated the standard skill files but did not create
a Codex MCP configuration. I then added the .codex/config.toml file:
[mcp_servers.aspire]
command = "aspire"
args = ["agent", "mcp", "--non-interactive", "--nologo"]
Codex can also put MCP servers in its user-level configuration. I chose the project file because this server is meaningful in an Aspire workspace and should start with that workspace. Codex’s MCP setup documentation explains the shared Desktop, CLI, and IDE configuration model.
The --non-interactive flag prevents prompts from blocking the MCP child process. --nologo keeps
the protocol stream quiet.
4. Pin the repository’s default AppHost
The repository contains one AppHost, but I still made that choice explicit in
aspire.config.json:
{
  "appHost": {
    "path": "src/AppHost/AppHost.csproj"
  }
}
Now both people and agents can use aspire run, aspire start, aspire wait, and telemetry
commands without repeating an AppHost path.
5. Verify it in the Codex desktop app or CLI
MCP configuration is loaded when the coding environment starts. A configuration added halfway through a Codex task does not add new tools to that already-running task, which tripped me up the first time.
Codex’s local clients share MCP configuration. The project-level .codex/config.toml is used by
the desktop app, CLI, and IDE extension as long as the project is trusted. I did not need a second
Aspire configuration for the UI.
In the Codex desktop app, I opened the repository, started a fresh task, and checked the server
under Plugins → Settings → MCPs. After adding or changing an MCP server, save it and
select Restart. Typing /mcp in the composer is another quick way to see the connected
servers.
In the Codex CLI, I verified the same registration with:
codex mcp listThen I started a new codex session and used /mcp in the terminal UI. OpenAI’s
MCP documentation describes the shared configuration
and both verification paths.
In either client, the aspire server should be enabled and its command should resolve to
aspire agent mcp. If it does not connect, the most useful checks are:
aspire --version
aspire start --non-interactive
aspire agent mcp
The last command should start without an error; use Ctrl+C to stop that direct diagnostic run.
In a fresh desktop task, Codex was able to list the running AppHost, its resources, structured
logs, and traces. That was the check I actually cared about.
Starting an app for agent work
The commands in this section are Aspire CLI commands, not Codex CLI commands. I can run them in a normal terminal, let Codex run them from either client, or launch the AppHost from Rider. Once the AppHost is running, the Aspire MCP server can discover it regardless of where I am chatting with Codex.
For an interactive terminal session, I use:
aspire runWhen I want Codex to own the session, Aspire provides a detached start and an explicit health wait:
aspire start --non-interactive
aspire wait web --non-interactive
Waiting for the exact resource is important. A successful AppHost process does not mean every dependency is ready for the next action.
In both the desktop app and CLI, I can ask for the outcome instead of translating it into Aspire commands myself:
Start the Aspire app, wait for
web, and summarize the resource health. Do not make code changes.
Exercise the health endpoints, then identify the slowest traces and their dependency spans.
Find errors for
web, correlate them with traces, and explain the likely cause before proposing a fix.
The MCP server handles the resource, log, trace, and command operations. The same evidence remains
available from aspire describe, aspire otel logs, aspire otel traces, and
aspire otel spans when I want to inspect it directly in a terminal.
First case: why did the dashboard look empty?
The dashboard looked healthy, but the web resource stayed empty even after I made requests: no logs, traces, or metrics appeared.
I had started the AppHost with Rider’s Aspire Host run configuration. Before changing any code, I asked Codex to check three things:
- Is telemetry already configured in the application?
- Does the same application send telemetry when it is launched with
aspire start? - If that works, what is different about the process Rider launches?
The Service Defaults project already registered OpenTelemetry logging, ASP.NET Core and HTTP client tracing, and ASP.NET Core, HTTP client, and Npgsql metrics:
builder.Logging.AddOpenTelemetry(logging =>
{
    logging.IncludeFormattedMessage = true;
    logging.IncludeScopes = true;
});

builder.Services.AddOpenTelemetry()
    .WithTracing(tracing => tracing
        .AddSource(builder.Environment.ApplicationName)
        .AddAspNetCoreInstrumentation()
        .AddHttpClientInstrumentation())
    .WithMetrics(metrics => metrics
        .AddAspNetCoreInstrumentation()
        .AddHttpClientInstrumentation()
        .AddMeter("Npgsql"));

if (!string.IsNullOrWhiteSpace(
        builder.Configuration["OTEL_EXPORTER_OTLP_ENDPOINT"]))
{
    builder.Services.AddOpenTelemetry().UseOtlpExporter();
}
There was no obvious instrumentation gap to fill. Next, Codex used an aspire start launch as the
control case and confirmed that Aspire supplied the web process with OTEL_SERVICE_NAME, resource
attributes, and an OTEL_EXPORTER_OTLP_ENDPOINT.
That run worked. Before I sent traffic, the dashboard held 14 structured logs and one startup
dependency trace. After five requests across /alive, /health, and /, it held 26 logs and 18
traces. The Metrics view also showed ASP.NET Core Hosting, Routing, Kestrel, Authentication,
Authorization, and component instruments alongside Npgsql and HTTP client instruments.
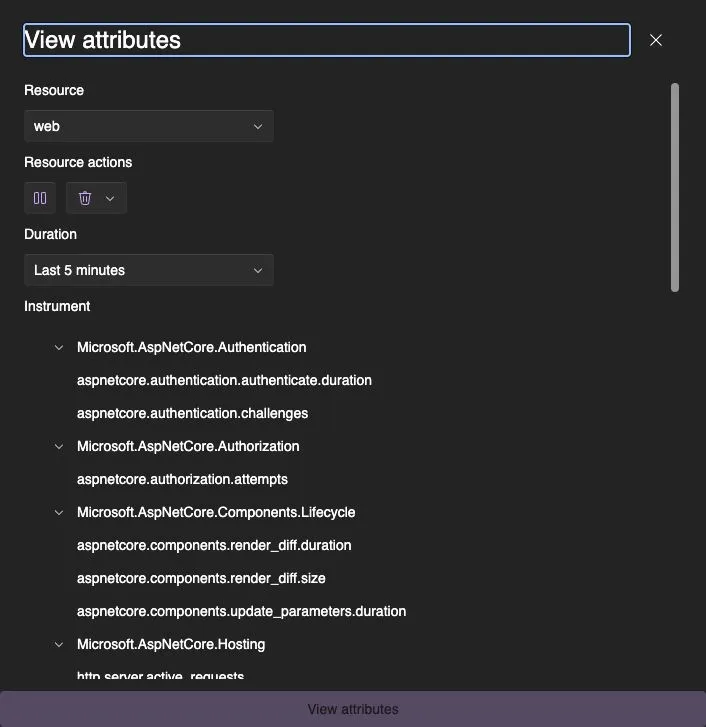
That ruled out the application and the Aspire dashboard. It also exposed a useful distinction: a new dashboard can be quiet simply because nobody has made a request yet, but it should not remain empty after controlled traffic. In my Rider run, it did.
This is where the agent connection paid off. In the same Codex task, I could ask it to inspect the
running resources and telemetry in Aspire, control Rider, and compare each Rider launch with the
working aspire start run. We could change one setting, restart, send traffic, and immediately
check whether the telemetry appeared. The chat became the place where the whole troubleshooting
loop happened.
The comparison led to the actual problem. Rider’s OpenTelemetry plugin was replacing Aspire’s exporter endpoint with the address of Rider’s local telemetry receiver. The receiver was not forwarding that data back to the Aspire dashboard in this setup.
This matches Aspire’s
telemetry flow documentation: Service Defaults
registers the .NET OpenTelemetry SDK, the AppHost supplies the local exporter settings, and the
dashboard receives the data over OTLP. If I launch src/Web by itself, outside the AppHost, this
application does not receive that exporter destination either.
A more useful demo: PostgreSQL goes away
Once Rider was fixed, I wanted to know whether the connection was useful for more than confirming configuration. I asked Codex to stop the local PostgreSQL resource, call the application’s readiness endpoint, explain what happened, and start PostgreSQL again.
The readiness endpoint is /health. It answers a practical question for a load balancer or
orchestrator: can this application reach the dependencies it needs to serve traffic right now? I
expected a quick 503 Service Unavailable while the database was stopped.
Codex translated that request into the same sequence I could have run myself:
aspire resource ResellingSystemDatabaseServer stop --non-interactive
curl --insecure https://localhost:7575/health
aspire otel traces web --non-interactive --format Json
aspire otel logs web --non-interactive --format Json
aspire resource ResellingSystemDatabaseServer start --non-interactive
aspire wait ResellingSystemDatabaseServer --non-interactive
The exact web port is assigned by Aspire, so Codex read the current endpoint from the running resource before making the request.
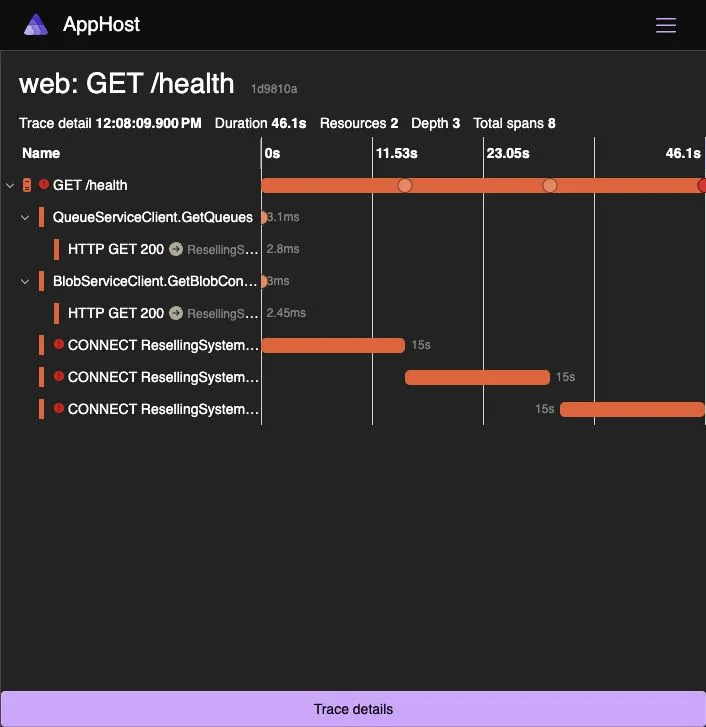
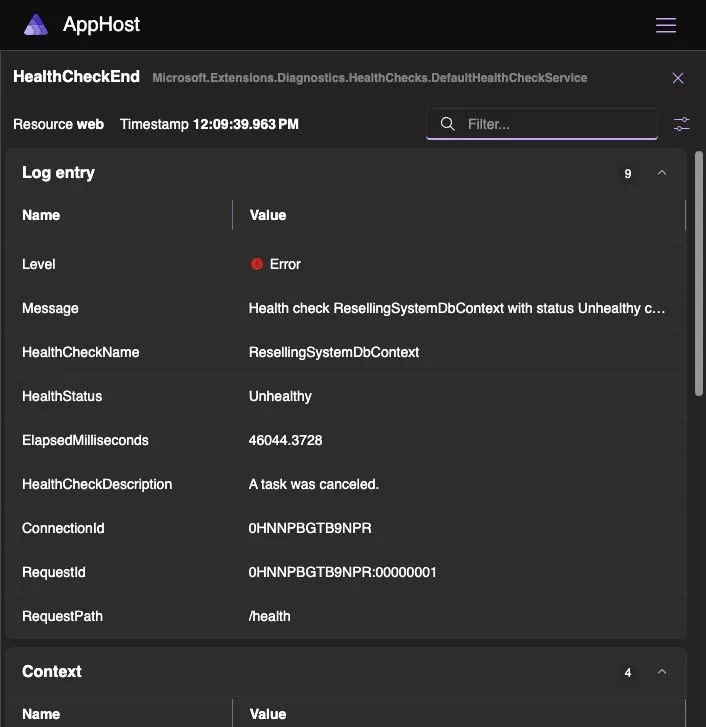
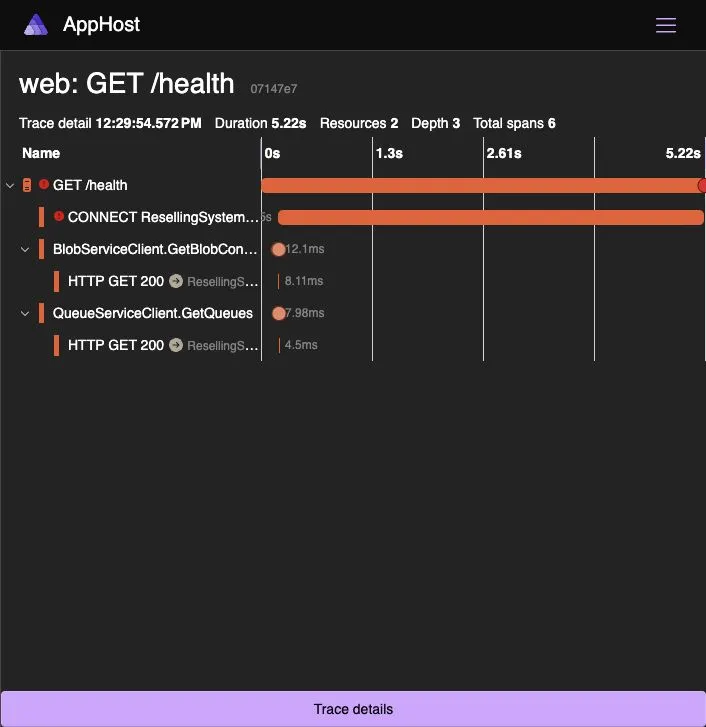
The request did return 503, but not quickly. It sat for 46.1s. In the trace, Codex found three
PostgreSQL connection attempts running one after another, each taking about 15 seconds. The
structured health log did not mark the database check unhealthy until all three attempts were
finished.
Retries still make sense for normal database work. They do not make sense for a readiness endpoint that exists to give a quick yes-or-no answer.
Making the readiness check fail quickly
The database setup had two related pieces. EF Core used EnableRetryOnFailure() for normal
application queries, while Aspire’s EnrichNpgsqlDbContext added tracing, metrics, and a database
health check. That generated health check used the retry-enabled DbContext, which is why one
readiness request turned into three long connection attempts.
I wanted to keep retries for real application work and keep Aspire’s Npgsql telemetry. I disabled only the generated health check, then added a small check whose only job is to open one new PostgreSQL connection with a five-second limit:
builder.EnrichNpgsqlDbContext<ResellingSystemDbContext>(settings =>
    settings.DisableHealthChecks = true);

builder.Services.AddHealthChecks().AddAsyncCheck(
    nameof(ResellingSystemDbContext),
    async cancellationToken =>
    {
        var connectionString = new NpgsqlConnectionStringBuilder(
            builder.Configuration.GetConnectionString(
                "ResellingSystemDatabase"))
        {
            Pooling = false,
            Timeout = 5
        };

        try
        {
            await using var connection = new NpgsqlConnection(
                connectionString.ConnectionString);
            await connection.OpenAsync(cancellationToken);
            return HealthCheckResult.Healthy();
        }
        catch (NpgsqlException)
        {
            return HealthCheckResult.Unhealthy(
                "PostgreSQL connectivity check failed.");
        }
    },
    timeout: TimeSpan.FromSeconds(6));
The important parts are easier to understand one at a time:
DisableHealthChecksremoves only the check generated byEnrichNpgsqlDbContext; its tracing and metrics stay in place.Pooling = falseforces the probe to open a real connection instead of borrowing one that was already open before PostgreSQL stopped.Timeout = 5limits that connection attempt to five seconds.- The six-second health-check timeout is an outer safety net and supplies cancellation to the asynchronous connection attempt.
After rebuilding the live AppHost, I repeated the same outage. The first corrected /health
request returned 503 in 5.27s, and its trace contained one bounded connection attempt instead
of three retries.
After PostgreSQL restarted, /health returned 200 again.
Performance, logs, traces, and metrics
I wanted more than a single good-looking trace, so I used the same prompt in the Codex desktop app that I could have used in the CLI:
Send ten requests to the readiness endpoint, summarize p50 and maximum trace duration, identify the longest dependency span, and compare the result after the change.
The original 46.1s result came from one trace, so there was no useful percentile to calculate.
After the change, I stopped PostgreSQL and sent ten readiness requests. Aspire recorded all ten:
| Run | Samples | p50 trace | Slowest trace | PostgreSQL work |
|---|---|---|---|---|
| Before the change | 1 | — | 46.1s |
Three connection spans of about 15s each |
| After the change, database stopped | 10 | 5.002s |
5.011s |
One connection span; longest was 5.005s |
| After PostgreSQL restarted | 1 | — | 0.019s |
One successful connection span in 0.018s |
The recovery request returned 200 to the client in 0.044s. The trace and client timings differ
slightly because they measure at different boundaries, but they tell the same story: one bounded
attempt while PostgreSQL is unavailable and a fast response when it is back.
Each part of the telemetry answered a different question. The traces showed that the request was slow and that PostgreSQL connection attempts consumed nearly all of its time. The structured log reported the failed health check. The Metrics view confirmed that ASP.NET Core and database metrics were arriving.
Codex could read the resources, logs, and traces through Aspire MCP. It could not read metrics directly in the version I tested, so I opened the Metrics view in the Aspire dashboard instead.
Avoiding port conflicts between agents
Running several coding tasks in parallel is becoming normal. I may have one Codex task working in a Git worktree while I am testing another change in a different worktree. If both start the same Aspire application with its usual settings, their dashboards, web projects, databases, and other resources can compete for the same ports.
Aspire’s isolated mode gives each run its own ports and isolated user-secrets scope:
aspire start --isolated --non-interactiveRunning a second instance from the same directory stops the first one, so each parallel instance also needs its own worktree:
git worktree add ../ResellingSystem-agent-b -b codex/agent-b

(
  cd ../ResellingSystem-agent-b
  aspire start --isolated --non-interactive
)
I tried this with two worktrees and both applications ran at the same time with separate dashboard and web ports. Each task had its own branch, working directory, AppHost, and resource graph instead of interrupting the other task. Aspire MCP can list and select the AppHost a task should inspect when more than one is running.
Security boundaries worth keeping
aspire agent mcp is a local STDIO connection. It gives the agent resource metadata, logs, and
traces, but not environment variable values, secrets, source files, raw network traffic, or host
access. Telemetry can still contain anything the application writes to it, so sensitive data should
stay out of logs and traces. A resource the agent should not inspect can also be marked with
ExcludeFromMcp() in the AppHost.
What changed for me
By the end, I was not excited because Codex had one more tool. The payoff was that it could follow the same running application through the whole task:
- Start the AppHost and wait for its services to become healthy.
- Use the endpoints assigned to that running AppHost.
- See what the logs and traces look like before changing code.
- Stop PostgreSQL, observe how the application fails, and then start it again.
- Follow the slow request from its trace into the database attempts and health log.
- Repeat the same request after the change and compare the timings.
- Stop an agent-owned AppHost when the task is finished.
In this case, that kept me from rewriting OpenTelemetry configuration that already worked. It also found the Rider routing problem and a slow readiness check I was not looking for. We finished with Rider sending telemetry to Aspire and the database check failing in about five seconds instead of 46.
For me, that is the point of connecting an agent to Aspire: it can check its assumptions against the application I am actually running rather than relying on source code alone.
Further reading
- Use AI coding agents with Aspire
- Aspire skills
- Aspire MCP server
- Codex MCP setup
- Codex plugins
- Aspire for agents: Transform how you build and deploy distributed apps
Aspire’s setup flow also supports VS Code with GitHub Copilot, Copilot CLI, Claude Code, and OpenCode. The exact configuration file differs, but the underlying split remains the same: skills teach the workflow, and the STDIO MCP server supplies live local runtime context.